clear all;
close all;
Fc=100;
Fc2=300;
Fs=1000;
n1=5;
n2=25;
Wn=2*Fc/Fs;
Wn2=2*Fc2/Fs;
f=linspace(-Fs/2,Fs/2,1024);%frequency domain.
[b,a]=butter(n1,Wn,'low');
%butter function is used
% to create filter coefficients.
[c,d]=butter(n2,Wn,'low');
% in third column of
%butter function we decide whether it is low pass filter
% or high pass filter
[y,u]=butter(n1,Wn2,'high');
[x,z]=butter(n2,Wn2,'high');
%LOW PASS FILTERS
[h,w]=freqz(b,a);
h=freqz(b,a,1024);
%with freqz function we obtain the frequency response
%of our filter.
[h1,w1]=freqz(c,d);
h1=freqz(c,d,1024);
%HIGH PASS FILTERS
[h2,w2]=freqz(y,u);
h2=freqz(y,u,w2);
[h3,w3]=freqz(x,z);
h3=freqz(x,z,w3);
plot(abs(h));
hold on;
plot(abs(h1));
hold on;
plot(abs(h2));
hold on;
plot(abs(h3));
legend('LP order 5','LP order 25','HP order 5','HP order 25');
% APPLYING THE FILTER TO A SIGNAL
t=0:1/Fs:0.5;
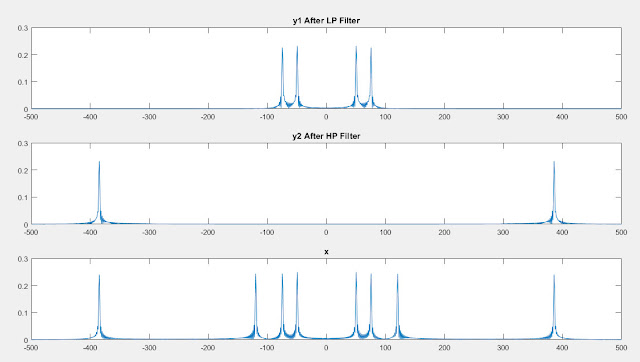
sig=cos(2*pi*50*t)+sin(2*pi*75*t)+cos(2*pi*120*t)+sin(2*pi*385*t);
y1=filter(c,d,sig);
%In time domain filter function
% takes two inputs which are filter coefficient(c and d)
%vectors and it takes the signal which is wanted to filter.
y2=filter(x,z,sig);
figure(2);
y1=fft(y1,1024);
% after filtering we can use fft function
%to obtain our signal in frequency domain.
% PLOTTING
subplot(3,1,1);
plot(f,fftshift(abs(y1))/1024);
title('y1 After LP Filter');
y2=fft(y2,1024);
subplot(3,1,2);
plot(f,fftshift(abs(y2))/1024);
title('y2 After HP Filter');
sig=fft(sig,1024);
subplot(3,1,3);
plot(f,fftshift(abs(sig))/1024);
title('x');
Hiç yorum yok:
Yorum Gönder